Introduction
Useful technical analysis indicators can help you find profitable short or long positions. So far, I have written two articles explaining some of the most prevalent indicators among traders. In the first article, I described MAs, MACD, OBV, A/D Lines, and Stochastic Oscillator. In the second article, I also elaborated on other useful technical analysis indicators, including RSI, Bollinger Bands, Fibonacci Retracement, and Ichimoku Cloud. This article introduces five more indicators and explain how you can use them to open trades.
Aroon Indicator
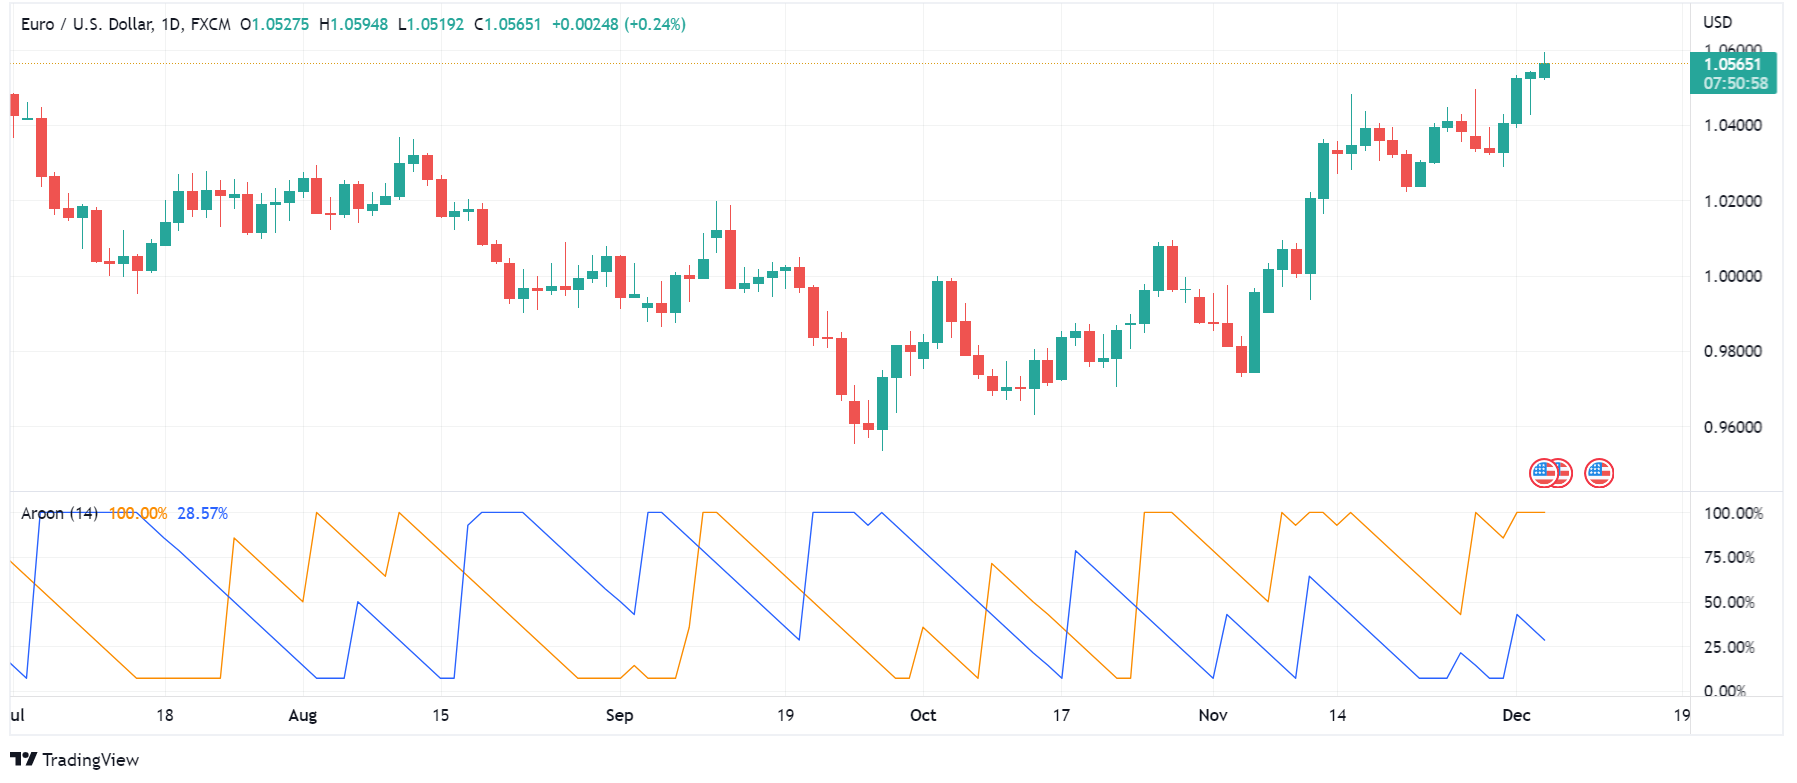
Aroon indicator is one of the technical analysis indicators that shows the trend direction and strength. The indicator measures the spans between the highs and lows in a given time frame. In other words, this indicator measures the number of highs and the span between them to determine an upward trend and gauge its strength. Conversely, the Aroon indicator also counts the number of lows and the spans among them to determine a downward trend and estimate its strength. Aroon indicator works based on the idea that if the price is moving upwards, it should set new highs; if it is moving downward, it should set new lows.
Aroon indicator shows the trend strength using two lines. The Arron Up line shows the strength of a bullish trend, and the Aroon-down line reveals the strength of a downward trend. Aroon lines move in a graph which is scaled from zero to 100. The preset time frame for the Aroon indicator is 25 periods.

How to Interpret Data from Aroon Indicator?
The closer the Aroon-up line is to zero, the weaker the up trend and the stronger the downtrend. Inversely, the closer the Aroon-down line is to zero, the weaker the downtrend and the stronger the upward trend. Aroon indicator shows the last 25 periods on a scale of zero to 100. So, the Aroon-up line above 50 indicates the price has seen a new high in the previous 12.5 periods. An Aroon-down line below 50 means that there has been a new low in the last 12.5 periods. When the Aroon-up or Aroon-down line approach 100, it means that the price has seen a new high or low very recently.
Another reading of the Aroon indicator is when both lines are moving below 50, which is a sign of indecisiveness in price direction. In this situation, you can expect breakouts. Furthermore, you can get short or long signals from Aroon-up and Aroon-down crossovers. For example, when Aroon-up cuts above Aroon-down, it can indicate a good entry point for a buy position. Conversely, if Aroon-down crosses below Aroon-up, it can be an opportunity for a sell position.
The problem with the Aroon indicator is that since it calculates the highs/lows and the spans between 25 periods, it does not provide entry/exit points in time. As a result, you may get the signals after the price has considerably moved. Additionally, the Aroon indicator does not care for the movement size; it only takes the number of highs/lows in 25 periods. Therefore, you should use the Aroon indicator with other gadgets to help you understand the market volume.
Directional Movement Index
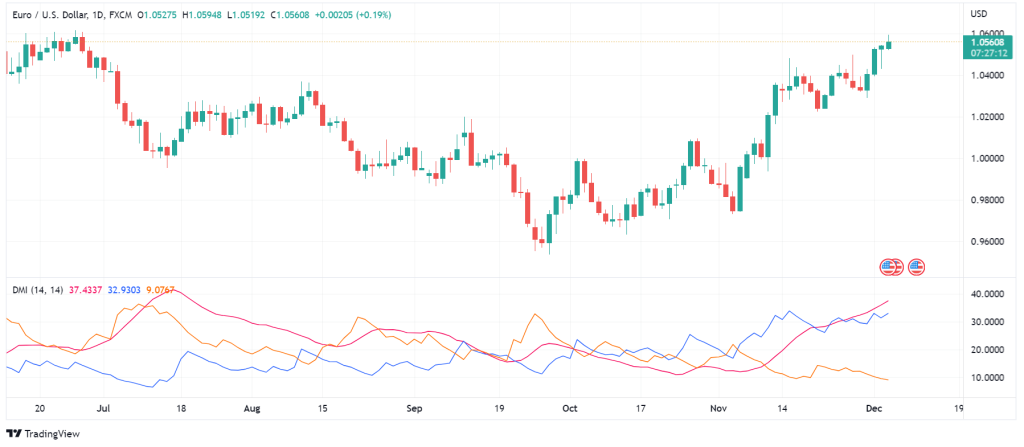
One of the useful technical analysis indicators for identifying the trend strength is Directional Movement Index (DMI). DMI measures the Positive Directional Index (+ID) based on the average highs and the Negative Directional Index (-ID) based on the average lows on the price chart. +ID and -ID combined with the trend line indicate the trend strength in DMI.
In other words, the DMI indicator consists of three lines. The first is the +ID line which is based on prior highs and is blue by default. The second line is -ID which is based on prior lows and is usually orange. The third line is the Average Directional Index (ADI) which is typically red (or crimson). The first two lines show the price momentum, and the third line indicates the trend strength, usually in 14 periods.
How to Interpret Data from Directional Movement Index?
Generally, when +ID (blue) is above -ID (orange), it means that the price is pushing towards an uptrend. Contrariwise, when the -ID is above +ID, the price is under a downward trend. Another reading of DMI involves the +ID and -ID crossovers. If the +ID cuts above the -ID, you can expect an uptrend and take long positions. On the contrary, if the +ID crosses below the -ID, a downward trend may take over, and you can take short positions.
Moreover, if the +ID line is moving above 30 and the -ID line is below 20, it means that the uptrend is strong. On the other hand, if the -ID is high above the +ID, it shows that the downward trend has strength, and you can place sell orders. When the two lines are moving close to each other, it means either the price movements are two volatile or they are ranging. Regarding the ADI line (red), you can use it to confirm the trend strength. When the ADI line is above 25, the trend is strong, and when it is below 20, the trend is weak.
The problem with DMI is that the crossovers in this indicator occur very frequently, which increase the chance of false signals. This is especially true when the ADX is moving below 25. It is best to use DMI with other non-correlated indicators to filter out false signals and prevent loss of capital.
Parabolic Stop and Reverse
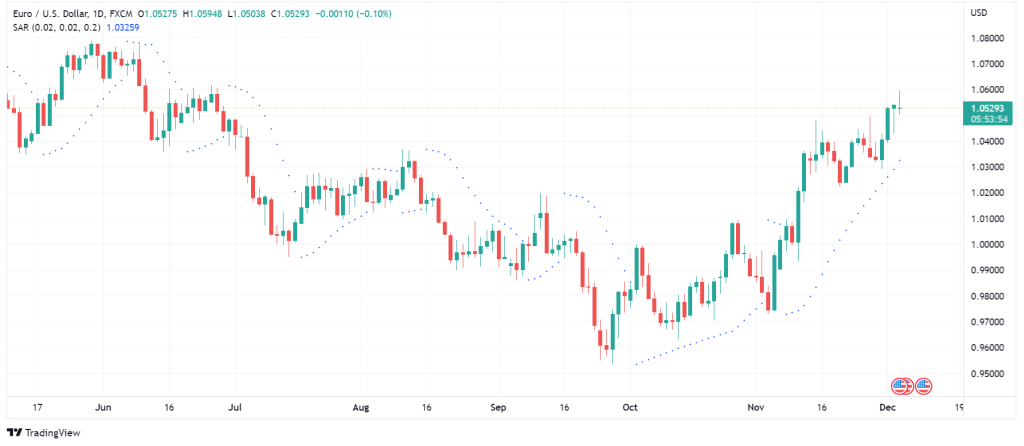
Parabolic Stop and Reverse (SAR) is another mode of useful technical analysis indicators that helps you find trend direction as well as good entry and exit points. Also, Parabolic SAR can function as an indicator of reversals. Unlike other indicators, Parabolic SAR is demonstrated as a series of dots above and below price bars instead of using lines. The indicator works best when the price is moving in a strong trend, either up or down.
How to Interpret Data from Parabolic SAR?
When the dots appear above the candles, they imply that the price is under bearish pressure. Inversely, when the dots are below the candles, they convey that the price is under buying pressure. The primary purpose behind developing the indicator is to find stop-loss points. You can set a stop-loss for your positions at the same level as the indicator dots. When the dots change position from below to above the candles or vice versa, you can expect a change in the trend. Also, the dots follow the price candles and, for example, when the price ascends, the dots will go up as well. The use of this indicator is not practical when the price is moving sidewise or when the movements are highly volatile. Hence, to avoid false signals, you should use the Parabolic SAR indicator when there is a strong trend in progress.
You can also confirm the Parabolic SAR signals with information you get from other indicators such as MAs, RSI, and ADX. For instance, if the Parabolic SAR dots are below the candles (bullish market) and the candles are closing above a mid- to long-term MA, you can have some confidence that the upward trend is strong. Conversely, if the dots are above the candles and the candles are moving below a mid- to long-term MA, you can take short positions. Overall, the key point in using Parabolic SAR is trading based on the trend.
Super Trend Indicator
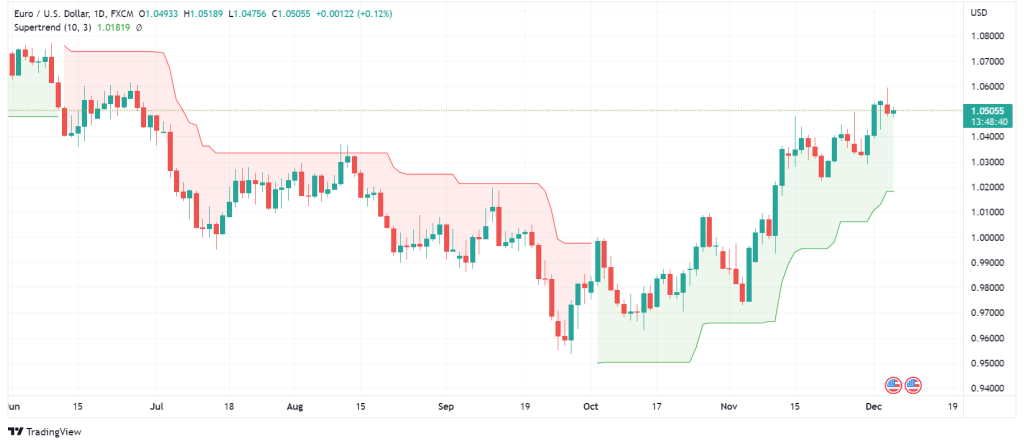
The super trend indicator is one of the useful technical analysis indicators used for identifying the trend direction. The super trend indicates the trend direction based on the period and multiplier. Since the super trend indicator is extremely sensitive to volatility, ATR plays an important role in super trend calculations. Usually, a ten-day period is used to calculate the ATR value. Also, the multiplier multiplies the ATR value and is usually set to three. The indicator is plotted on the chart either above or below the candles. When the super trend is above the candles, it shows the color red, and when it is below the candles, it shows green.
How to Interpret Data from Super Trend?
When the super trend indicator is above the candles (red), it means you a downtrend is in progress, and you should take short positions. When the indicator is below the candles (green), this means the trend is bullish, and you should take long positions. Another use of the super trend is finding the spot for placing stop-loss. In a bullish trend, the green line below the green-shaded area is a good point for placing a stop-loss. Inversely, in a bearish trend, when the red-shaded area is above the candles, the red line can be a good place for stop-loss.
Like other indicators, you should use the super trend in conjunction with other useful technical analysis indicators. For example, you can deploy a 7 and 21-period EMAs on the chart together with the super trend indicator. In this strategy, the super trend helps you decide whether to take long or short positions, and the EMAs indicate the entry or exit points. Thus, when the super trend is red, and the 21-period EMA crosses down the 7-period EMA, you can take a short position and place a stop-loss according to the above guidelines. On the other hand, when the super indicator is green and the 21 EMA cuts above 7 EMA, you can take a long position.
I should also note that the super indicator is not reliable when the price is ranging or when it is volatile. You should wait until the price movements form a strong trend and then take short or long positions based on the indicator info.
Average True Range
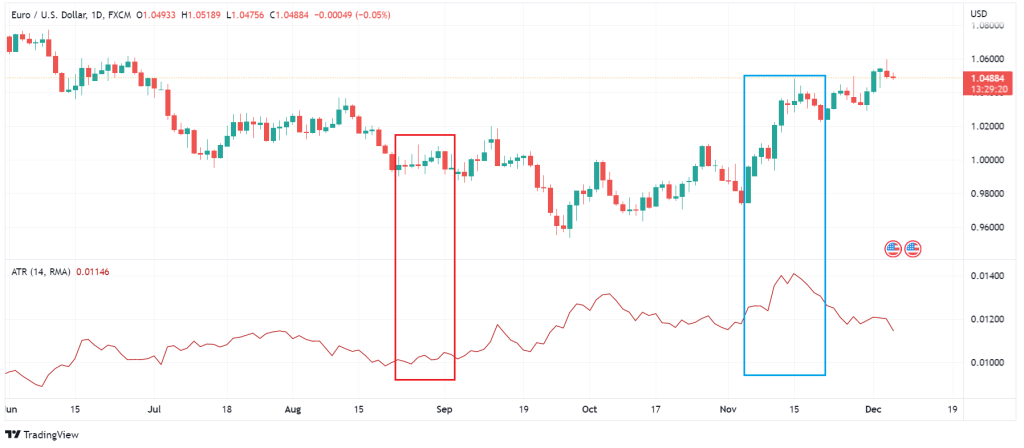
One of the useful technical analysis indicators you can use to visualize market volatility is the Average True Range (ATR). ATR measure the average price movements in a specific time frame which is usually set to 14 periods. The line on the ATR graph moves based on the price, not its direction. Therefore, when we have candles with large bodies, the ATR value will increase. Contrariwise, when the candles have small bodies (e.g., Doji candles), the ATR values will decrease. In other words, as you can see in the chart below, the more price volatility, the more significant the change in ATR values and vice versa.
How to interpret Data from the Average True Range?
The first thing to note is that the ATR line movements react to price volatility and do not indicate the trend. For example, when a bullish trend reverses, and the price plummets, the ATR line will continue to go up. If the ATR values remain low for a long time, you can deduce the price is consolidating. It may continue the current trend or move in a new direction. In addition, you can use ATR to find stop-loss levels. You need to multiply the ATR by two to find the stop-loss level for your position.
For instance, if you want to take a long position for 100 pips in a given currency pair, and the current ATR value is 3, you should set the stop-loss on 94 pips (stop-loss = 100 – 32). Inversely, for a short position, you should place the stop-loss at 106 pips. Of course, you should compare the current ATR movements with the previous ones to better understand how volatile the price movements are.
Final Words
In this article, I tried to introduce a variety of useful technical analysis indicators most traders use in their trading strategies. Aroon indicator, DMI, parabolic SAR, and the super trend can clarify the price direction and help you estimate the trend strength. Additionally, ATR can visualize the price volatility and help measure the super trend. In the next article, I will introduce some other useful technical analysis indicators. So, if you liked what you read, do not miss out the future posts. For more information, you can visit https://academy.investopedia.com/?aca_ref=header_home_link_1.
Disclaimer
The guidelines we mentioned in this article are only for educational purposes. Please do not regard them as financial advice. Note that investing in financial markets requires a comprehensive trading plan. Any rash decision can easily spoil your capital.