Introduction
Useful technical analysis indicators go a long way in determining entry and exit points for your trades. This is the fourth article I have written so far to introduce popular indicators, and you can extract short or sell signals from them. The first article explains MA, EMA, MACD, OBV, A/D Line, and Stochastic Oscillator. In the second article, I elaborated on RSI, Bolinger Bands, Fibonacci Retracement, and Ichimoku Cloud. You can also learn about the Aroon indicator, DMI, Parabolic SAR, super trend and ATR in the third article. I will introduce several more indicators in this article and hope you can devise a successful trading strategy based on the information you read.
Commodity Channel Index Technical Indicator
Commodity Channel Index (CCI) is a useful technical analysis indicator designed for tracking trend changes in the long term. You can also apply CCI for short time frames to identify pullbacks and trend corrections. CCI basically compare the current price with the price mean in a given time. CCI is plotted below the trading chart showing a scale above and below zero. The CCI line usually moves between -100 and +100 and sometimes surpasses these levels. I should note that as the period increase, the CCI tends to move between the -100 and +100 bands. Conversely, in shorter time frames, CCI is more likely to go above +100 or below -100. CCI calculations are usually based on 30-period data, but you can also use it for 20 and 40 periods.
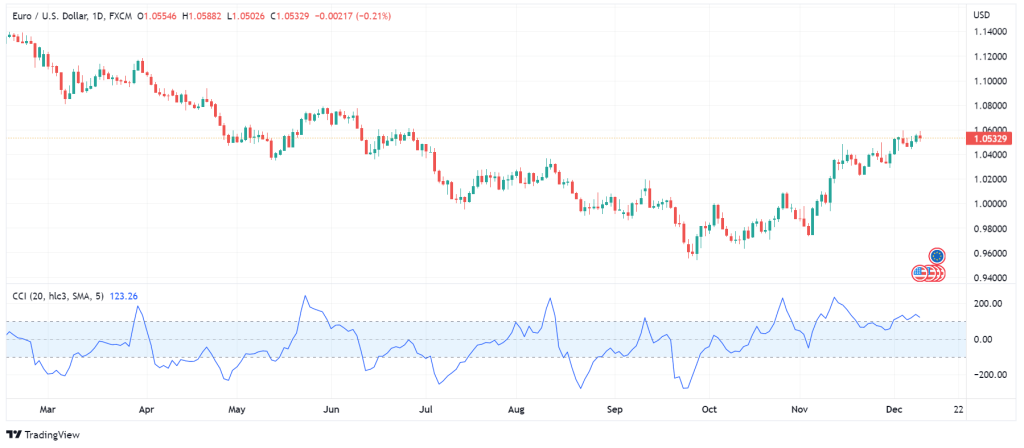
How to Get Trading Signals from Commodity Channel Index?
Generally, when the CCI goes above +100, this means the asset’s value is above the mean in the given period. CCI larger than +100 shows the trend is bullish, and you can place long positions. When the CCI goes below -100, it indicates the price is lower than the mean in the given period. CCI smaller than-100 signifies a downtrend, and you can take short positions. Of course, you should pay attention to the number of periods as well. As mentioned above, the less number of periods in CCI calculation, the more volatile, the more volatile the CCI index. Therefore, short-period CCI gives more trading signals and is suitable for day traders or scalpers. Contrariwise, long-term traders should include more periods in the CCI calculation.
It is best to use a combined strategy when using CCI. For example, day traders can use long-term CCI to identify the dominant trend and take positions in the direction of the trend. To illustrate, let’s say the long-term CCI is showing an uptrend, and the CCI is below -100. In this situation, the trader buys the asset while it is below -100 and exits the position when CCI goes above +100. The wise thing is to take sell positions in short time frames when the long-term CCI is below -100 and buy positions when the long-term CCI is above +100. Remember to trade according to the trend! On the other hand, long-term traders can place orders based on an extensive CCI and choose their entry and exit points using short-term CCI. Please note that CCI (especially short-term) cannot be trusted when the price movements are volatile.
William Percentage Range Technical Indicator
William Percentage Range (AKA Williams %r), named after its designer Larry Williams, is a trend-following indicator that examines the overbought and oversold levels. The indicator has a scale of zero to -100 that you can use to find entry and exit points for your trades. The indicator has a similar function to Stochastic Oscillator, comparing the closing price with the closing price in a given period. The preset period for Williams %r is 14, but you can modify that for more extended time frames.
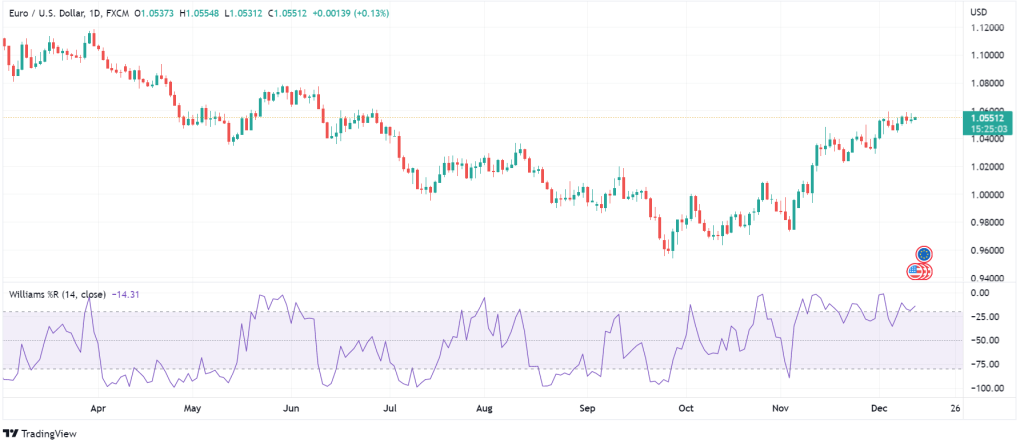
How to Get Trading Signals from Williams %r?
Simply put, when Williams %r is between -20 and zero, it shows the asset is overbought; when it is between -80 and -100, the asset is oversold. Of course, being overbought or oversold does not imply you can expect a trend reversal. Overbought means the asset’s price is near its average buying closing price in the last 14 periods. Similarly, oversold means the asset’s price is near its average selling closing price over the previous 14 periods.
For more accurate and reliable signals, you can use Williams %r in conjunction with a 100-period moving average. Based on this strategy, you can take a short position when the closing price is below the MA, and the Williams %r is below -50. The signal is valid until %r goes above -50 and the candlestick closes above the 100-period MA. To be on the safe side, you can exit the position when you observe any of the above signs. You can also buy this strategy to get long signals. You can place buy orders when the candle closes above the 100-period MA, and the %r is above -50. If the closing price drops below the MA or %r declines below -50, you should exit the position. The upside of this strategy is the prevention of false signals when the price movements are volatile.
Donchain Channel Technical Indicator
The Donchain channel is a technical analysis indicator sensitive to volatility. You can use the indicator to determine the trend direction and find entry and exit points for your trades when the market is ranging. What makes the Donchain channel unique is the use of median instead of mean. The indicator graph consists of three lines, namely, the middle line (blue), the upper (green) and the lower (red) bands. The upper band shows the highest highs, and the lower band demonstrates the lower lows in the given periods. The default value for the number of periods is 20, but you can also modify that for more extended time frames. The middle line is the subtraction of lower band from the upper band, divided by two. In other words, the middle line is simply a centerline between the upper and lower bands.
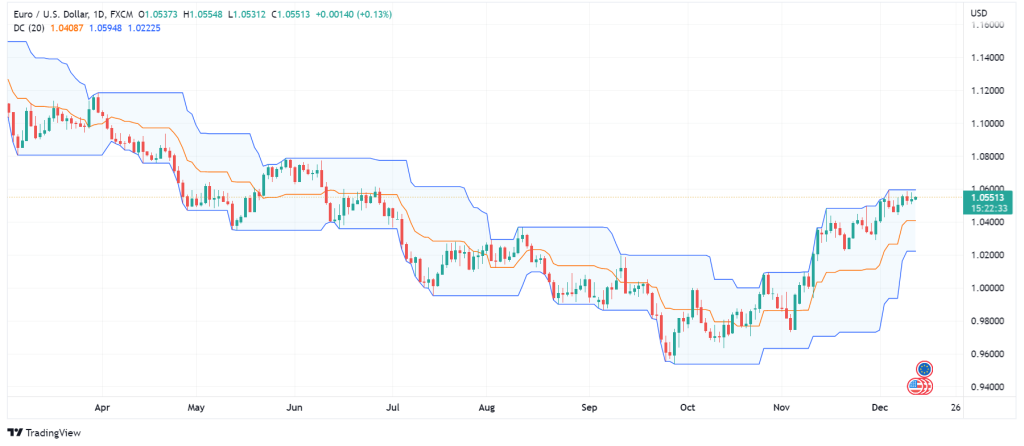
How to Get Trading Signals from Donchain Channel?
The Donchain channel can give you different information about the asset’s chart. First, the direction of the Donchain channel (the whole graph) is a good indicator of the trend. By way of explanation, if the price closes above the median and the graph is moving upward, this shows a strong bullish trend. Similarly, if the price closes below the median and the graph is going down, this means the market is strongly bearish. Second, the closeness of the bands to the centerline illustrates the market’s volatility. When the upper and lower bands are close to the middle line, the volatility is low, and the market is ranging. Conversely, when the upper and lower bands are farther apart from the centerline, it shows high volatility.
The third use of the Donchain channel is for ranging markets. When the channel is moving straight (low volatility), the upper and lower bands show the breakout levels. If the price touches the upper band twice, you can expect a bullish trend and place long orders. Inversely if the price touches the lower band a couple of times, you should prepare for a downward trend and take short positions. The fourth trading strategy regarding the Donchain channels involves using the median. When the channel is moving upwards, the median is the best place for setting a buy order. Similarly, the median is an optimal place for setting short orders in a downward trend. In this strategy, you should wait for pullbacks. Pullbacks are the most profitable entry points in a trending market.
The median can also serve as a price level for exiting positions. For instance, if you took a short position in a downtrend and the price touches the median a couple of times, you should set your stop loss at the median level. This can also be a sign of trend reversal, and you can use it (cautiously) to take an early long position. Of course, like any other technical analysis indicator, Donchain cannot give reliable signals by itself, and you should combine it with other indicators. For example. Average Directional Index (ADI) can help you realize the strength of breakout levels in the Donchain channel.
Keltner Channel Technical Indicator
The Keltner channel has a similar function to the Donchain channel in that it examines volatility. The difference, however, is that the Keltner channel shows overbought and oversold levels as well. Linda Raschke modified the Keltner channel by applying the Average True Range (ATR) in the channel calculations. The inclusion of ATR in the Keltner channel made the trading signals more accurate. Keltner channel consists of three lines. The upper line shows the EMA + (ATR multiplier), the middle line demonstrates the EMA, and the lower band shows the EMA – (ATR
multiplier). The EMA is based on the last 20 periods, and the multiplier is set to 2 by default. You can modify the channel for longer periods but increasing the number of periods makes EMA movements slower.
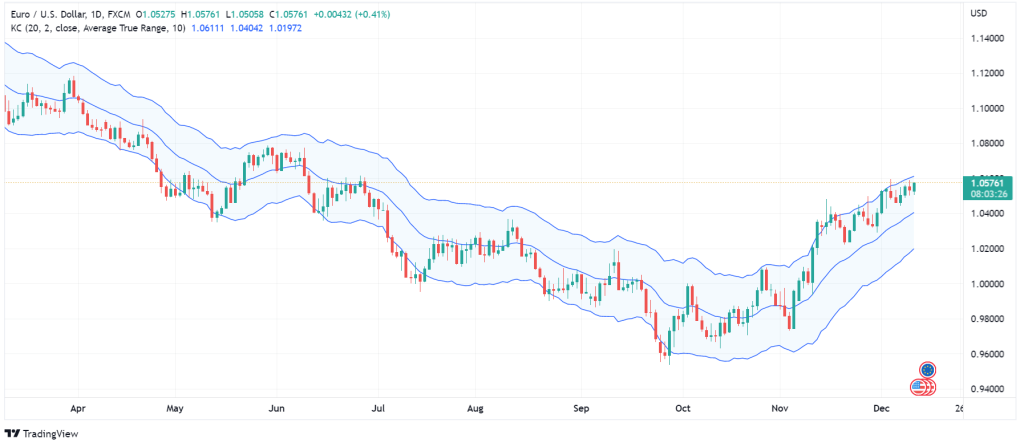
How to Get Trading Signals from Keltner Channel?
The channel’s slope shows the trend direction; when the channel is moving upwards, the chart is bullish, and when it is moving down, the trend is bearish. When the channel is relatively straight, it shows a ranging market. Moreover, if the channel is moving up and the price frequently hits the upper band, it indicates the uptrend’s strength. But if the channel is moving up and the price is hitting the lower band, it implies the uptrend is losing momentum. Upper and lower bands can represent the support and resistance levels in a ranging market.
In terms of a trading strategy for the Keltner channel, you can apply the Donchain trading strategy here as well. Additionally, you can use the Keltner channel to understand overbought and oversold levels. To elaborate, when the price goes above the upper line but drops back below the line, it shows the market bulls cannot push up the price anymore, and there might be a retracement. On the contrary, in a downtrend, when the price crosse below the lower line but goes above the line again, you can expect a retracement. You can make the Keltner channel trading signals more reliable by using the ADI to reduce the number of false signals.
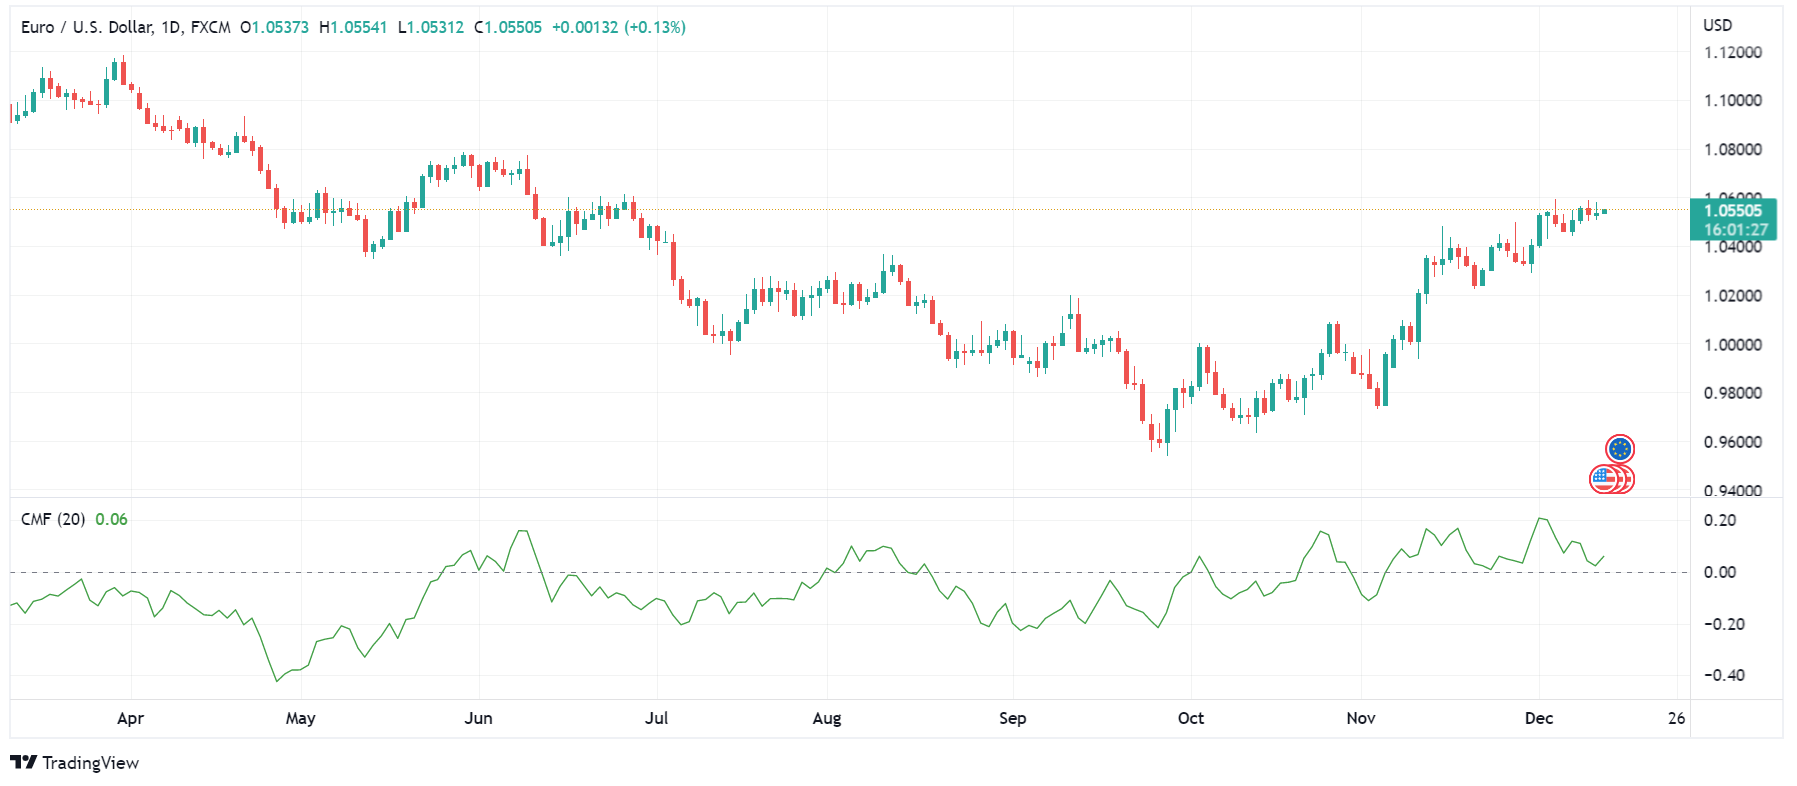
Chaikin Money Flow Technical Indicator
Another useful technical analysis indicator for trading based on the volume is Chaikin Money Flow (CMF). By default, the indicator measures the highs and lows in the last 21 periods, but you can customize it for longer time frames. The idea behind CMF is that volume positively correlates with price. In other words, the nearer the current price is to the average high, the more volume the asset has (accumulation). Conversely, the closer the current price gets to the average lows in the last 21 periods, the lower the volume is (distribution).

How to Get Trading Signals from CMF Technical Analysis Indicator?
In the CMF graph, level zero is a turning point in interpreting the data we get from the indicator. If CMF is above zero, the asset’s value is accumulated, and when it is below zero, the price is distributed. The zero level can also help you identify retracements. When CMF crosses below or above zero, you can expect a retracement in the current trend. The best way to use CMF is with indicators that demonstrate the support and resistance levels. If the price goes above the resistance level and CMF crosses above zero, you can confirm the breakout direction.
You can use the divergence between price movements and CMF to get buy or sell signals. When the candles form a higher high in the overbought zone, and CMF shows a lower high, it means the price is decreasing, and you should place sell orders. Conversely, if the candles form a lower low in the oversold territory and CMF shows a higher low, you can expect a bullish trend and take long positions.
Final Words
Technical analysis indicators help you find the optimal zone for entering and exiting the trades. The important thing to remember is that no single indicator can give you a comprehensive analysis of the chart. You should apply non-correlated indicators on the chart to increase the accuracy of your positions.
If you liked what you read, check out the previous three articles written on the same subject. Also, for more information, you can visit https://academy.investopedia.com/?aca_ref=header_home_link_1.
Disclaimer
The guidelines we mentioned in this article are only for educational purposes. Please do not regard them as financial advice. Note that investing in financial markets requires a comprehensive trading plan. Any rash decision can easily spoil your capital