Introduction
Candlestick Patterns visually represent the market status. Traders use different resources to interpret the trading charts and find profitable entry and exit points. Candlestick patterns are among the most useful trading strategies. This article will introduce candlestick patterns and elaborate on their use in understanding price movements. After reading the article, you will be able to comprehend different parts of the candlesticks and the various shapes they come in. This will help you predict the next movement and the direction of the trend line, especially when combined with useful technical analysis indicators.
Different Parts of Candlesticks
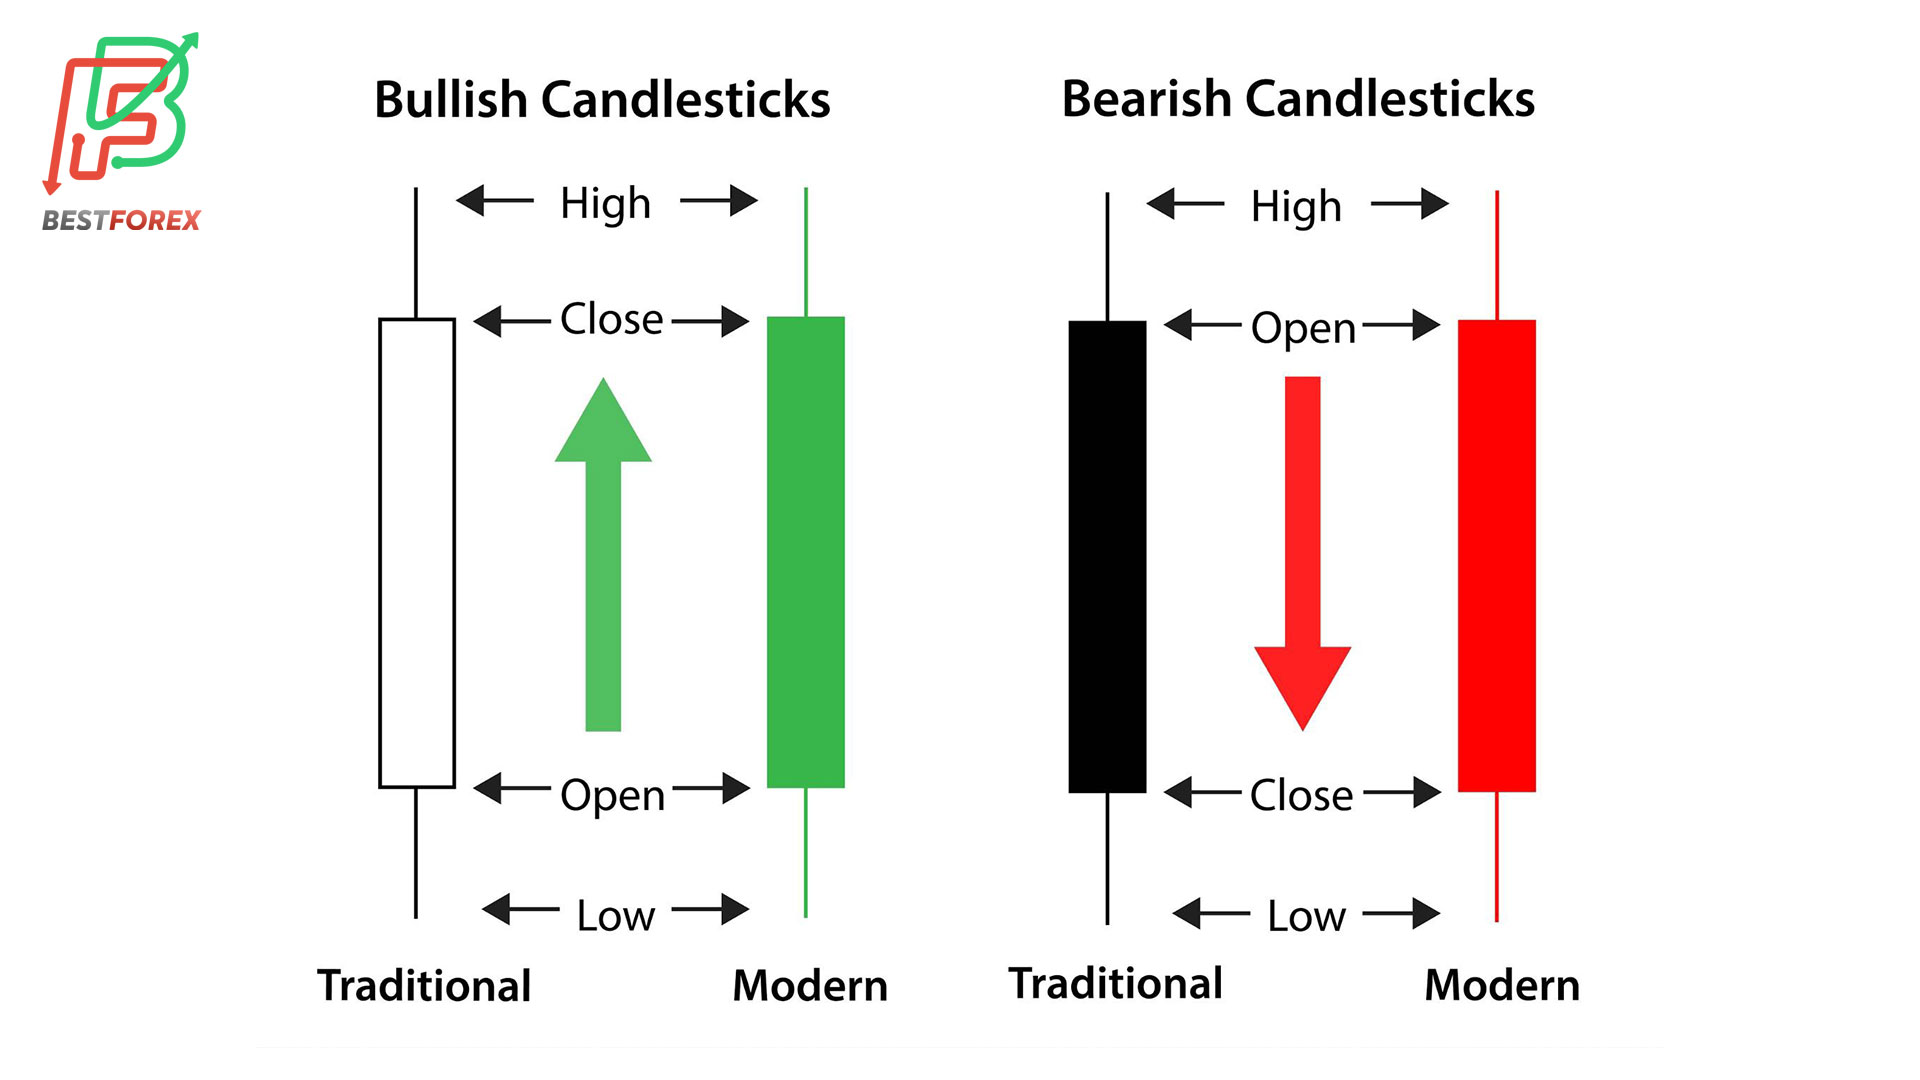
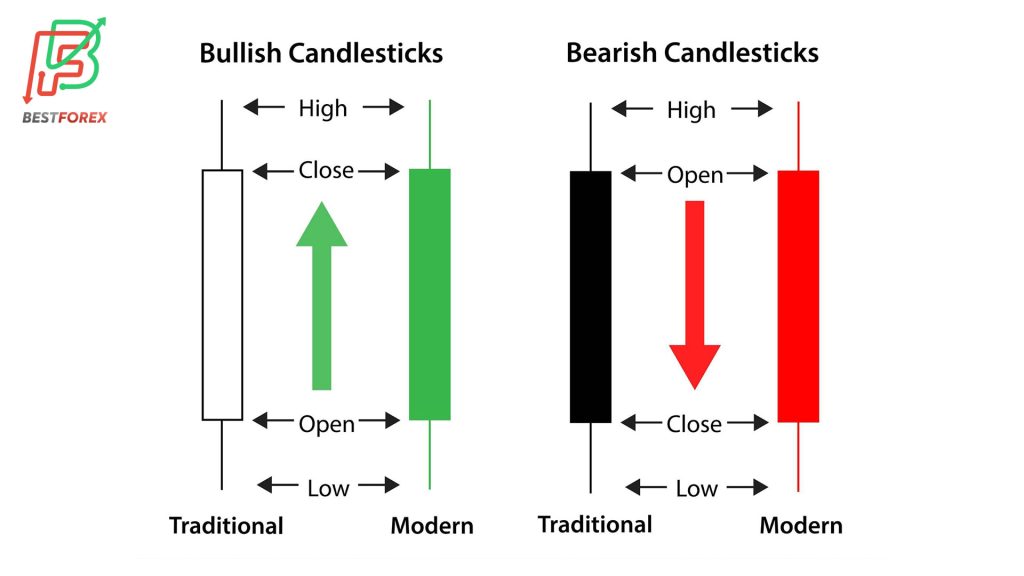
As you can see in the picture, each candle consists of five parts. The upper and lower shadows, closing and opening points, and the body of the candle. Shadows (also known as tails) indicate the highest (upper shadow) and lowest (lower shadow) prices in a given session. If the closing price in a candle is higher than the closing price, the candle is bullish, meaning that the price has increased in the timeframe set for the candle. Inversely, if the closing price is lower than the opening price, the candle is bearish ad shows that the price has decreased in the respective timeframe. Bullish candles are usually green, but in more traditional charts, you can also see them in white. Bearish candles are red in today’s trading charts, but they used to be black in the past.
The length of the body or the shadows can shed light on the strength of buyers and sellers. Generally, a long green candle reveals the buyers’ dominance, and an extended red candle shows the sellers’ strength. Moreover, long shadows tell us about the asset’s price range in the given candle. If the upper shadow is significantly longer than the lower shadow, this means that buyers are more likely to take control of the session. On the other hand, if the lower shadow is considerably longer than the upper shadow, this indicates the sellers’ power to push down the price.
Candlestick Patterns
Candlestick patterns refer to the numerous shapes of single candles and the succession of several candles with different shapes. Metaphorically, each candle is a word, and several candles form a sentence that explains the price movements in the market. In the remainder of the text, you will learn about some of the most frequent candlestick patterns in the market.
Bearish engulfing bar
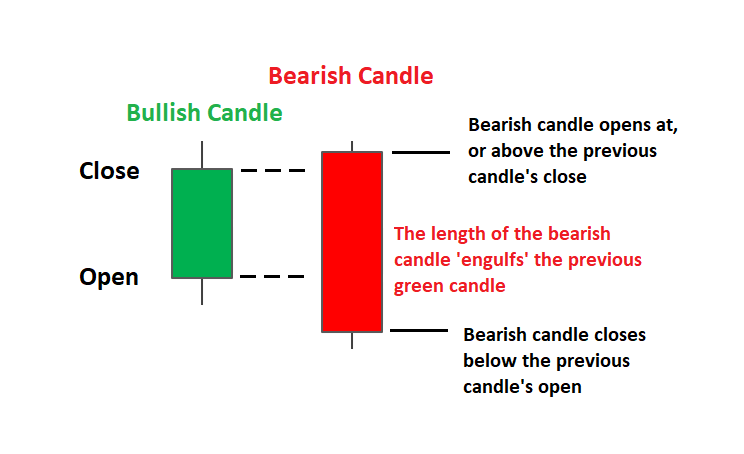
A bearish engulfing bar candlestick pattern consisting of two candles. The first candle is green, and the second candle is red. The red candle is about twice larger than (or at least the same size as) the green candle. In other words, as the name suggests, the red candle engulfs the green candle. The pattern indicates that the market bears are in control. Also, by observing the pattern, you can conclude that the bullish trend has ended, and a new bearish trend awaits. Of course, you need to confirm this by using related technical indicators.
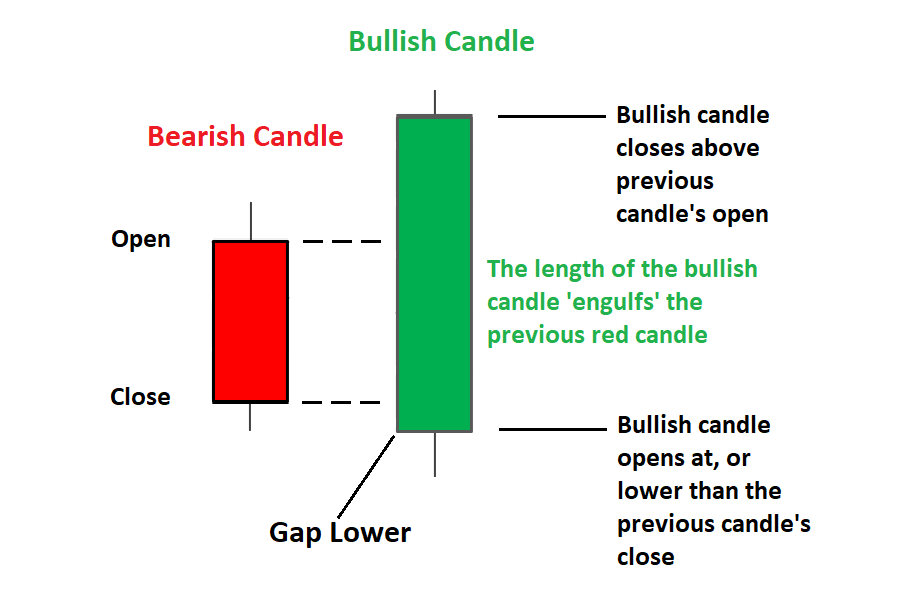
Bullish engulfing bar
The bullish engulfing bar is the reverse of the above pattern. The bullish engulfing pattern happens when a larger green candle follows a small-body red candle. The pattern represents the buyers’ strength and dominance in the market. Furthermore, if you observe the pattern in an uptrend, this means that the trend will continue. However, when the pattern appears in a downtrend, this implies the downtrend has lost momentum, and the trend will reverse.
Doji Candlestick Patterns
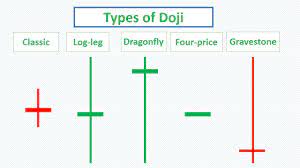
Doji candles form when the opening and closing prices overlap or are very close. The Doji candles show that neither the buyers nor the sellers have decided to push the price up or down. In other words, Doji candles represent a balance between buyers’ and sellers’ trading power. Doji candles usually appear on the chart after large candles and considerable price movements. In that case, Doji candles can signal the end of the current trend and the emergence of a new one.
Dragonfly Doji
A dragonfly Doji is a T-like candle in which the opening and closing prices overlap with the highest price in the session. The dragonfly Doji signifies a support or resistance level in the chart as well as a balance between supply and demand. The dragonfly Doji usually forms at the end of a downtrend and predicts an uptrend.
The Gravestone Doji
The gravestone Doji is the opposite of the dragonfly Doji. In gravestone Doji, the opening and closing prices overlap with the lowest price in the preset candle timeframe. In other words, gravestone Doji has little (or no) lower tail and a long upper tail. The pattern indicates that the market is testing strong resistance levels. Moreover, the gravestone pattern tells conveys the buyers’ unsuccessful attempt to push the price up and their loss of momentum. The formation of gravestone Doji in an uptrend shows that the trend is weak and may soon reverse.
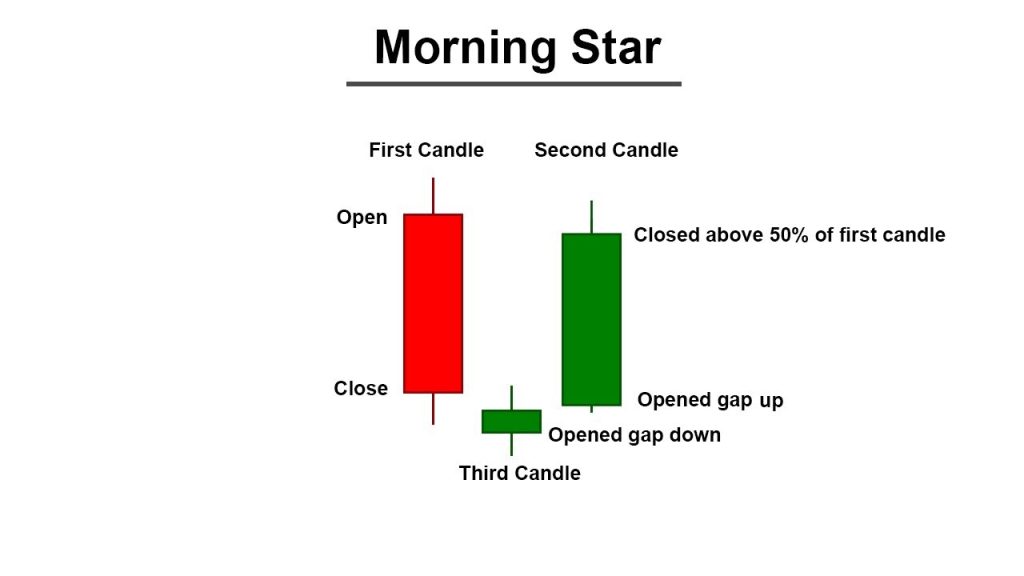
The Morning Star
The morning star pattern may remind you of the bullish engulfing bar saved for the small candle in between. In the morning star pattern, the first candle is red, longer than the second (either green or red), but shorter than the third candle, which is green. The second candle is either a Doji or has a small body. The pattern reveals that the sellers’ control over the price is weakening. The emergence of this pattern in support levels is a powerful signal for trend reversals.
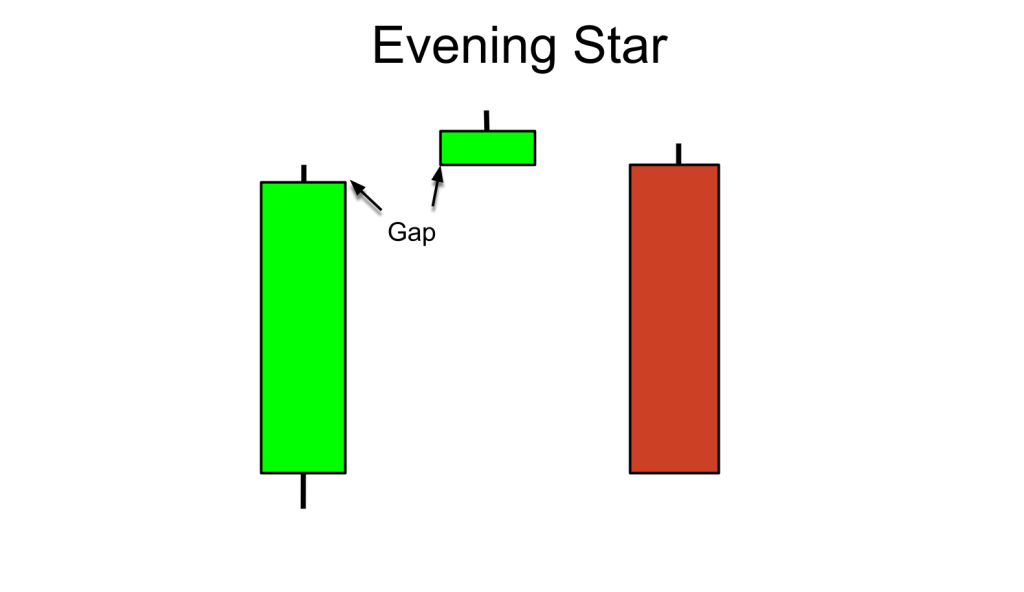
The Evening Star
Unlike the previous pattern, the evening star forms at the end of an uptrend. The pattern consists of three candles; the first candle is green and has a long body, and the second candle is either red or green but has a very short body. The third candle is red, and its body is longer (or at least the same size as) the first candle. The evening star means the sun has set in the market bulls’ realm, and the bears will take over. Observing the pattern in resistance areas strongly signifies a trend reversal and signals long positions.
The Hammer (Pin Bar) Candlestick Patterns
Another pattern you can use to confirm trend reversals is the hammer or pin bar pattern. As the name suggests, the candle looks like a hammer with a small body on the top and a long tail at the bottom. The hammer candles indicate that sellers did not have sufficient power to push the price down. Therefore, seeing this pattern in support levels confirms the bullish reversal.
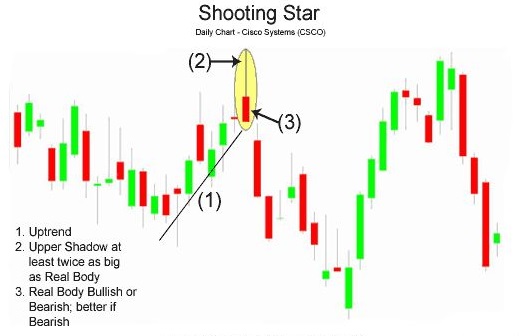
The Shooting Star
The shooting star (AKA bearish pin bar or the inverted hammer) when the opening and closing prices are near the lowest price. Shooting star candlesticks have short bodies and long tails that are at least twice the length of the body. When you see the pattern in an uptrend that has been going on for a while, it can be a sign of trend reversal. The shooting star reveals that buyers are making their last attempts to push up the price.
The Harami Pattern
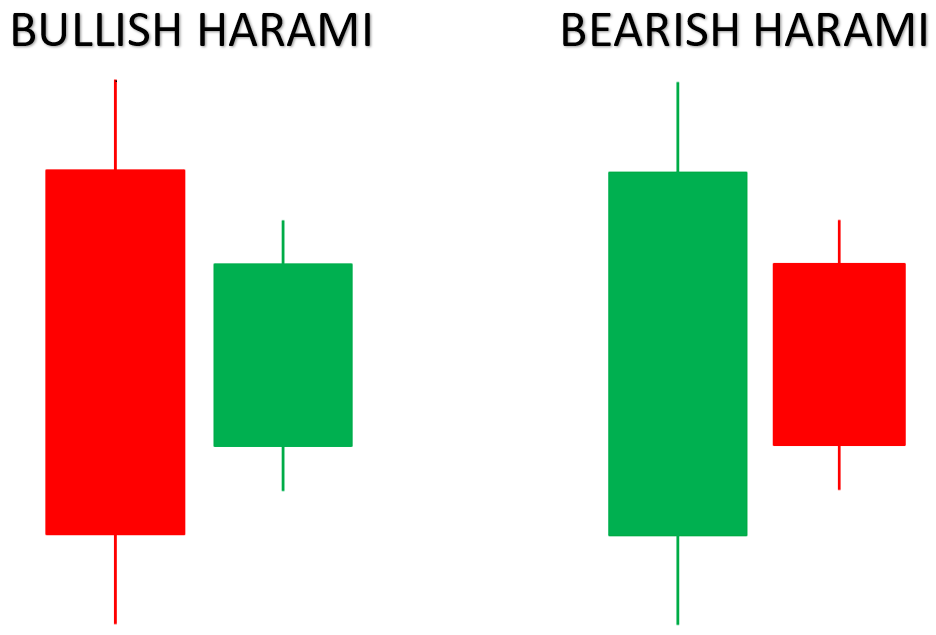
The Harami (i.e., pregnant in Japanese) pattern comprises two candles. The first candle (the mother candle) is twice larger than the second one (the baby candle). The second candle usually forms around the upper or lower body of the first candle. In this pattern, the colors of the candles are not important. All that matters is the formation of the mother and baby candles. The Harami pattern means the price is consolidating, and traders have not decided whether to continue the current trend or reverse it.
The Tweezers Candlestick Patterns
Tweezers Top
In this pattern, there are two candles which are almost the same size. The first candle is green, and the second one is red. In other words, the opening price of the green candle is near the closing price of the red candle. Inversely, the closing price of the green candle is almost the same as the red candle. The pattern means market bears are eligible to reverse the bullish trend.
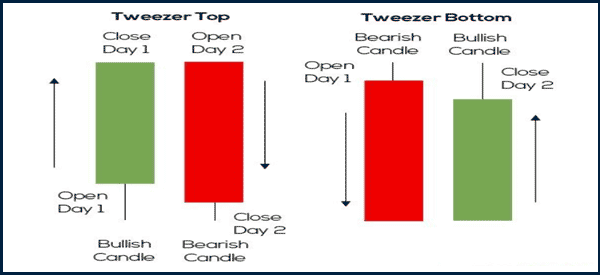
Tweezers Bottom
The tweezer bottom occurs in a downtrend and consists of two candles of (almost) the same size, where the first candle is red and the second one is green. The pattern tells us that the demand is increasing for the asset and the bears are unlikely to maintain the downward trend.
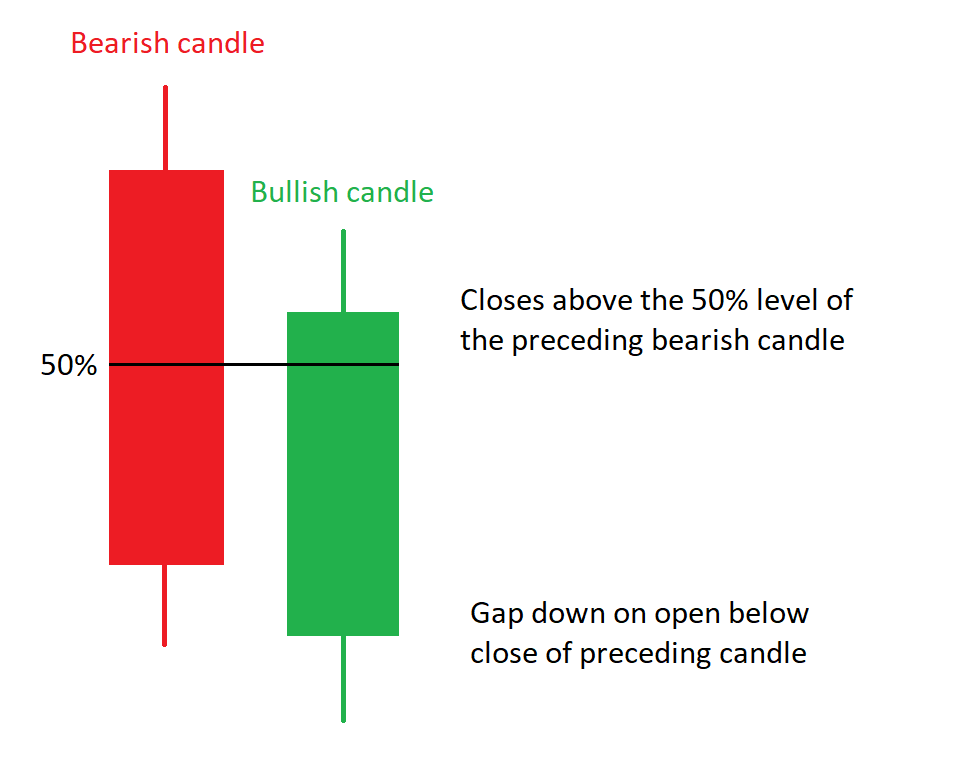
The Piercing Candlestick Pattern
The pattern consists of two consecutive candles where the first candle is bearish and the second candle is bullish. In addition, the second candle must open below the closing price and close above the middle of the first candle. Traders usually confirm the piercing candlestick pattern by waiting for the breakaway gap that forms at the beginning of a new trend. In a breakaway gap, the price gaps are higher or lower than support or resistance levels. The pattern usually forms at the end of a downward in support areas and signifies that buyers are coming into the play. The pattern is more popular among day traders in the stock market.
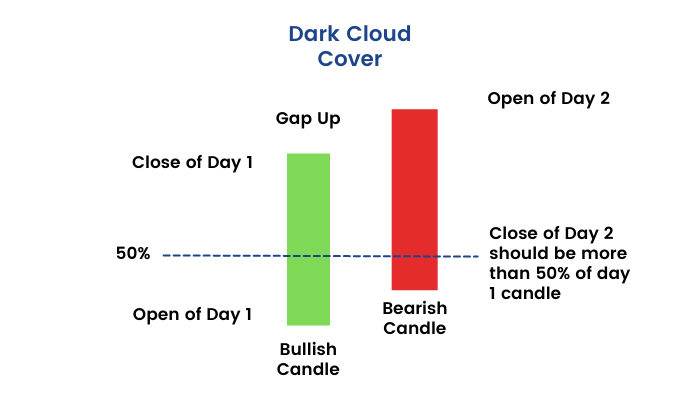
Dark Cloud Cover
In this pattern, a strong red candle follows a green candle of the same size. You can say the green candle is like the shadow of the red candle, which is like a cloud above the previous candle. The pattern is similar to the bearish engulfing pattern; while buyers try to increase the price, sellers eventually take over the session and push the price down. Traders use the pattern to find the best exit point for their positions. They can either exit their position at the closing price of the bearish candle or wait for the following bearish candle to confirm the pattern.
Three Inside up/down Candlestick Patterns
Like the previous patterns, traders use three inside up/down to determine trend reversals. The three-inside candlestick patterns resemble the Harami pattern saved for the third confirmatory candle in the former. The pattern does not indicate profit targets, and you should combine it with other technical strategies to find precise entry and exit points.
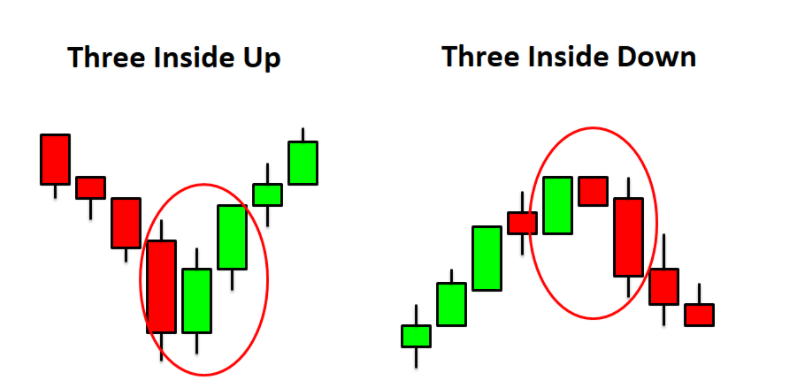
Three Inside Up
The three-inside-up pattern is a sequence of three consecutive candles. The first candle is red and has a large body. The second candle is green, and its body is about one-third of the previous candle and forms above the opening price of the red candle. The third candle is also green, and its opening price is above the closing price of the preceding candle, but its closing price is lower than the first (red) candle’s opening price. The pattern is indicative of a bullish reversal and buyers’ dominance on the price action.
Three Inside Down
The three-inside-down pattern also consists of three candles. The first candle is green with a large real body. The second candle is red, and its body is about one-third of (or even shorter than) the first candle. The closing price of the second (red) candle should not be higher than the opening price of the green candle. The third candle is red, too, and its opening price is lower than the closing price of the previous candle. However, the third candle’s closing price should be higher than the first (green) candle’s opening price. When the three-inside-down pattern emerges on the trading chart, you can expect a bearish reversal and prepare to take short positions.
Final Words
Candlesticks comprise the language of the trading chart. Traders need to understand what the various shapes and sequences of candlesticks imply and how they can use them to identify the trend status. It is best to combine candlestick analyses with other technical strategies, such as technical indicators, to take accurate short or long positions and trade profitably.
This article introduced most of the frequent patterns (e.g., engulfing, Doji, hammer, morning star, evening star, etc.) you may observe on the trading charts. You can also find more information about candlestick patterns and other technical analysis strategies here.
Disclaimer
The guidelines we mentioned in this article are only for educational purposes. Please do not regard them as financial advice. Note that investing in financial markets requires a comprehensive trading plan. Any rash decision can easily spoil your capital.